Discretion Is the Better Part Of Valor
Posted at 10:20 a.m. Eastern time.
To make better than average money in the stock market you have to do something different from the average investor. You have to be an iconoclast--thinking independently and finding the approaches that work for you, not blindly following someone else's program. In this blog I'm refining my own iconoclastic and eclectic ways of thinking. I'm not trying to convert anyone to my opinions or methods--I just hope to provide a useful perspective and inspire some other investors' thinking.


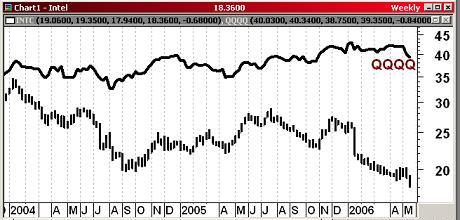
This weekly chart shows Intel's collapse starting in early 2004 while the NASDAQ 100 ETF (QQQQ at the top) has been rising slowly. The bullish case for Intel, or any respected company in this situation, basically rests on two legs. The fundamental case is that the company will turn around its earnings fall in x quarters. The technical case is that the stock market is stupid and doesn't recognize what a great company Intel is, thus driving the stock price irrationally low and handing the brave or astute investor a great buying opportunity.
I'm not in a position to judge the fundamental case. I'm not an expert on chip technology, and even if I were I'd be totally dependent on Intel's pronouncements to know when anything might be released, and predicting the market's reaction to new products is much more of a crapshoot than analyzing the technology. Without inside information or an extraordinary technical insight (such as discovering a flaw in a major new product), I don't see how an individual is going to get an edge on fundamental analysis without dumb luck.
I think the notion that the market is stupid is an oversimplification. On a short-term basis it's certainly over-reactive, but the idea of mass stupidity on Intel lasting for almost two-and-a-half years seems far-fetched to me. Even for an Iconoclast, it seems more rational to assume the market has been right and stay away until serious money starts flowing back into the stock. I don't see any reason to fight this pervasive relative weakness now.
Posted at 10:05 a.m. Eastern time.


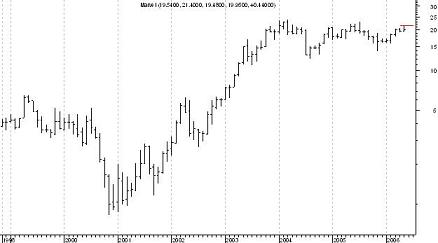
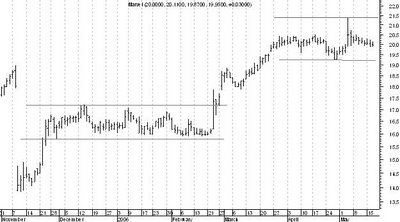
That volatility has flattened out in the last two years but it still isn't a sleepy stock. The chart below shows daily prices since November 1, 2005, and the tendency to trade in narrow ranges for several weeks:

Marvel has continued to drift along in a range lately, and today it was up marginally with no news. So far, people holding the stock haven't been eager to sell it, for whatever reason, and "strong hands" have to be seen as a positive. I don't really expect anything exciting will happen tomorrow, but I will get excited on a breakout above $20.50.

During this period the closing high was $19.44; a little over three months later the closing low was $7.42. Those levels are marked by the horizontal gray lines. The green arrows show resistance around $12. Clearly the bulls had trouble with the $12 level, finally breaking it last month. Now the stock is back down to $12. The theory of support and resistance says that resistance levels frequently become support after they are breached, so supposedly the odds are better than average that the price will hold here.
The dashed gray lines show Fibonacci retracement levels. The 38.2% retracement level is right at $12. Fibonacci theory says that this percentage gain from the low is significant.
I'm undecided if this sort of thing ever matters or if it's just a case of random movements happening to make recognizable patterns. I'd certainly like to believe these set-ups have predictive value, and I'll be watching FCEL tomorrow.